
A. Previous post | summary
Last week’s post provided background and history on US medical insurance, including agency-provided benefits, Medicare, Medicaid, and ACA.
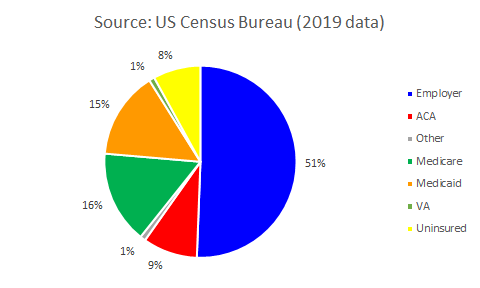
B. Healthcare insurance providers
- 92% of Americans (304-million) are insured
- 61% (200-million) private insurance
- 51% (167-million) employer-provided
- 9% (30-million) exchange-provided (ACA)
- 31% (103-million) public insurance
- 30% (100-million) Medicare or Medicaid
- 8% are un-insured (26-million)
- 61% (200-million) private insurance
- Source: US Census Bureau, under US Department of Commerce
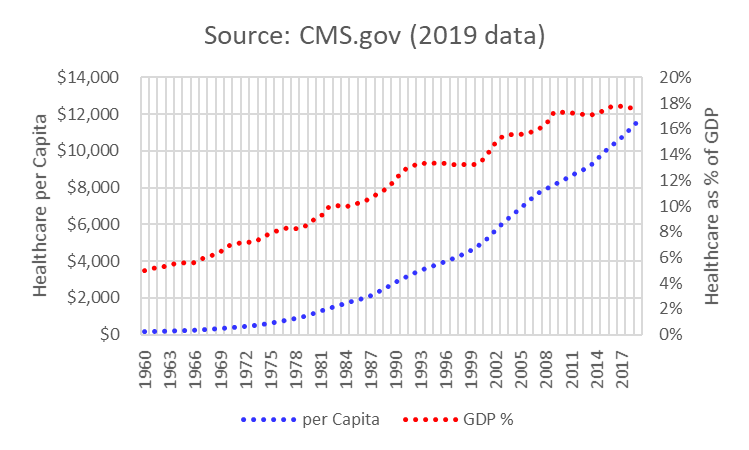
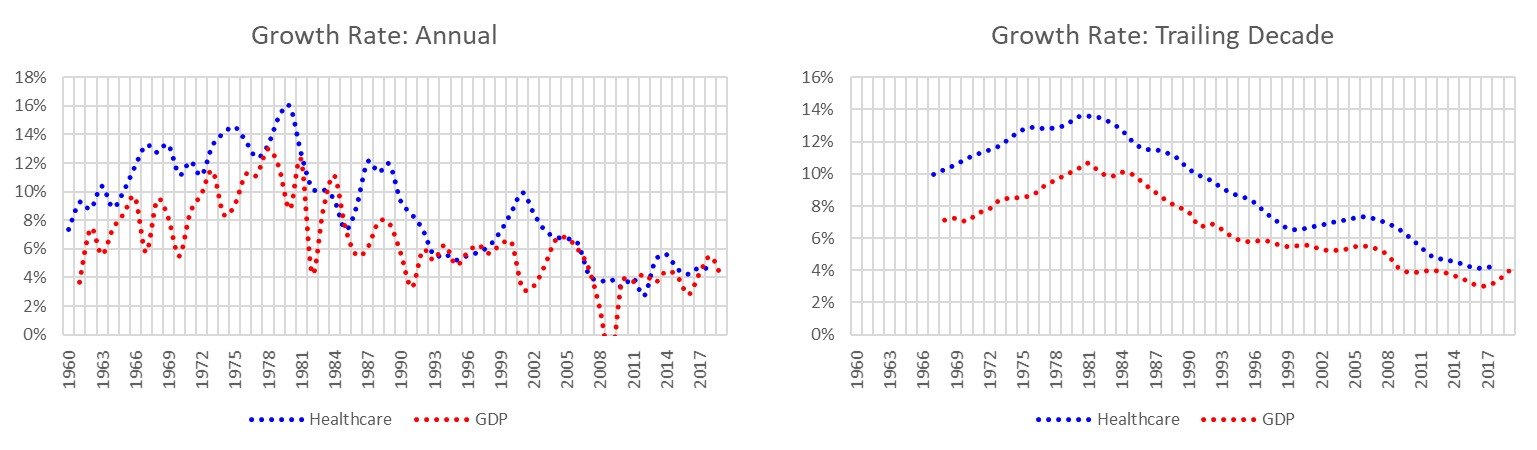
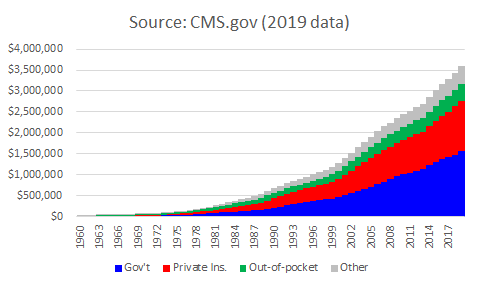
C. Healthcare cost trends
- GDP increased from $542-billion to $21.4-trillion, 1960 to 2019 (2019=100)
- For comparison, next five largest economies:
- China: $14.3-trillion
- Japan: $5.1-trillion
- Germany: $3.9-trillion
- India: $2.9-trillion
- United Kingdom: $2.8-trillion
- Healthcare spending increased from (1960 to 2019):
- $27-billion to $3.8-trillion
- 5% to 17.7% of GDP
- $146 to $11,462 per capita
- Healthcare spending eclipsed GDP growth
- Ten-year forecast (for 2028)
- GDP: $31.4-trillion
- Healthcare spending: $6.2-trillion
- Healthcare costs outpace GDP growth, increasing to 19.7% of GDP
- Healthcare spending per capita: $17,592
- Source: Centers for Medicare & Medicaid Services (CMS)
- Federal agency under US Department of Health & Human Services (HHS)
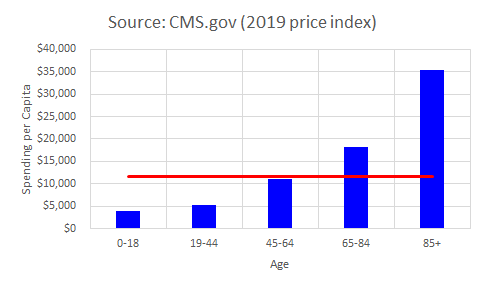
D. Who spends healthcare dollars
- Annual healthcare spend per capita $11,462
- Annual healthcare costs increase with age
- Over age 85, $35,000
- Age 65-84, $18,000
- Age 45-64, $10,000
- Age 19-44, $5,000
- Children under age 18, $4,000
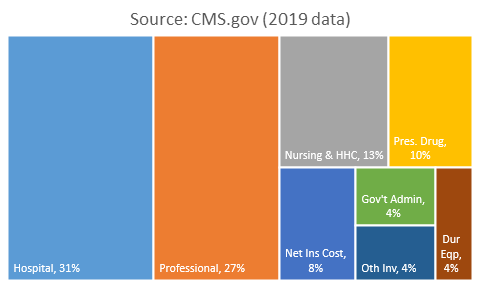
E. Where do healthcare dollars go
- Four categories account for 80% of healthcare spend:
- Hospital: $1.2-trillion (31%)
- Professional & dental: $1.0-trillion (27%)
- Nursing & home healthcare: $480-billion (13%)
- Prescription drugs: $370-billion (10%)
F. Who funds healthcare expenditures
- Primary sources of funding (88%):
- Government (Medicare, Medicaid, CHIP): 43%
- Private insurance: 33%
- Out-of-pocket: 11%
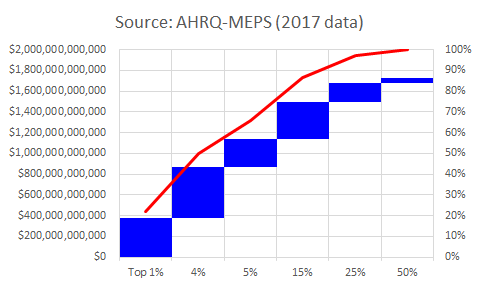
G. Distribution of healthcare expenditures
- Private healthcare spending (insurance & out-of-pocket): $1.7-trillion (2017)
- Top 25% of users account for $1.5-trillion (87%)
- Top 1%: $116,000 per capita
- Next 4%: $37,000 per capita
- Next 5%: $17,000 per capita
- Next 15%: $7,000 per capita
- Remaining 75% of US population account for $0.2-trillion (13%)
- Top 25% of users account for $1.5-trillion (87%)
- Source: Agency for Healthcare Research & Quality, Dept. of Health & Human Services
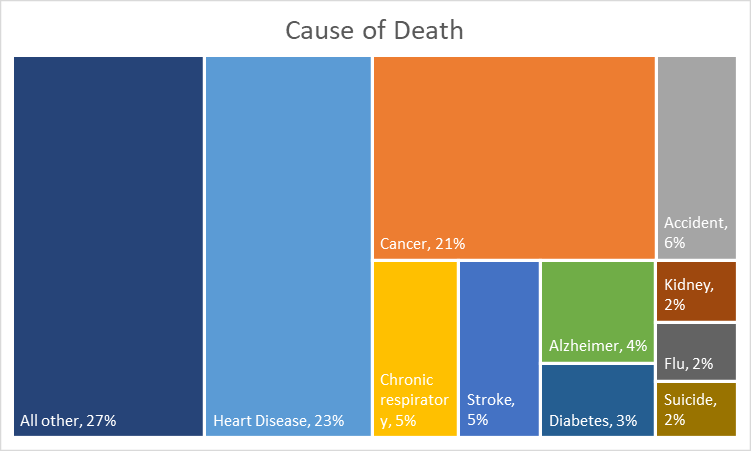
H. How do we die
2.8-million Americans died in 2019; top ten leading causes of death, include:
- Heart disease: 659,000
- Cancer: 600,000
- Accident (unintentional injury): 173,000
- Chronic lower respiratory disease: 157,000
- Stroke: 150,000
- Alzheimer disease: 121,000
- Diabetes: 88,000
- Kidney disease: 52,000
- Flu & pneumonia: 50,000
- Suicide (intentional self-harm): 48,000
- All other causes: 758,000
- Source: US Centers for Disease Control
I. Looking ahead | next post
Next week’s post will clarify the difference between socialized and universal healthcare, and highlight key healthcare policies of other nations.
